

How the use of data promoted an average farmer to one of the best

Pitstick Farms has been gathering farm, field and yield data since 1996. Putting all those data to use has promoted them to becoming one of the best performing farmers in Illinois.
Steve Pitstick and his son Dale run an about 2,000 hectare arable farm called Pitstick Farms in Maple Park, close to Chicago (Illinois). On a clay type soil they grow maize and soybean fairly evenly split. They have a yearly rotation on most hectares. Most of the land is rented through long term rental contracts. Steve is also chairman of the Illinois Soybean Association (ISA), district director and serves on the ISA Government Relations Committee. He also works as an advisor to startup ag tech companies.
‘We had no clue at all’
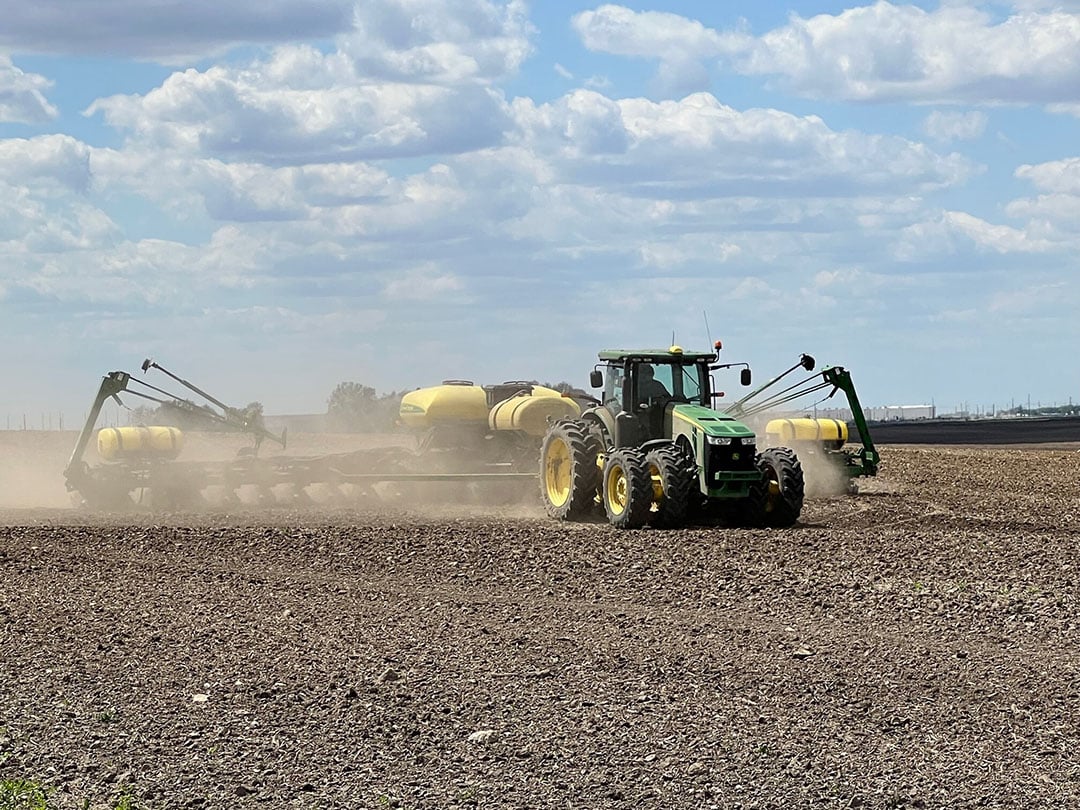
They are no-tillers to save on labour and other costs and to prevent soil erosion as much as possible. “We start planting as soon as the frost is gone to benefit from the growing season as long as possible. I want to see as much plant growth as possible before the longest day”, Steve Pitstick says. Plant protection measurements are mainly taken during planting.
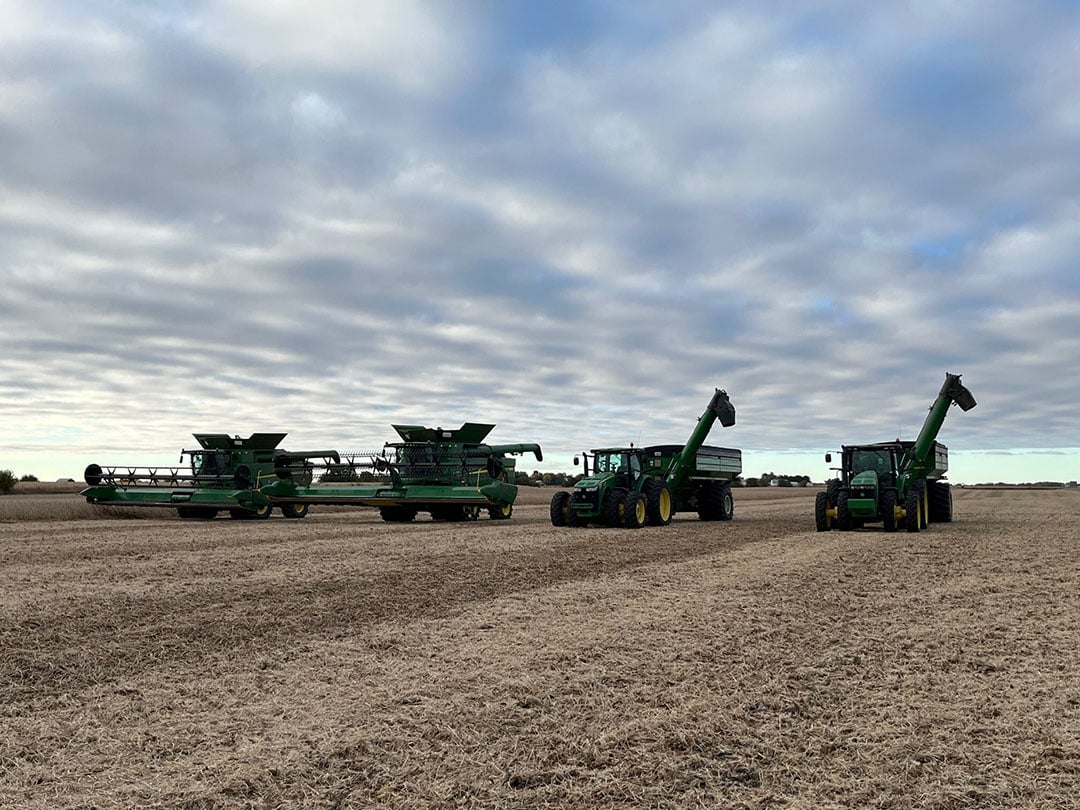
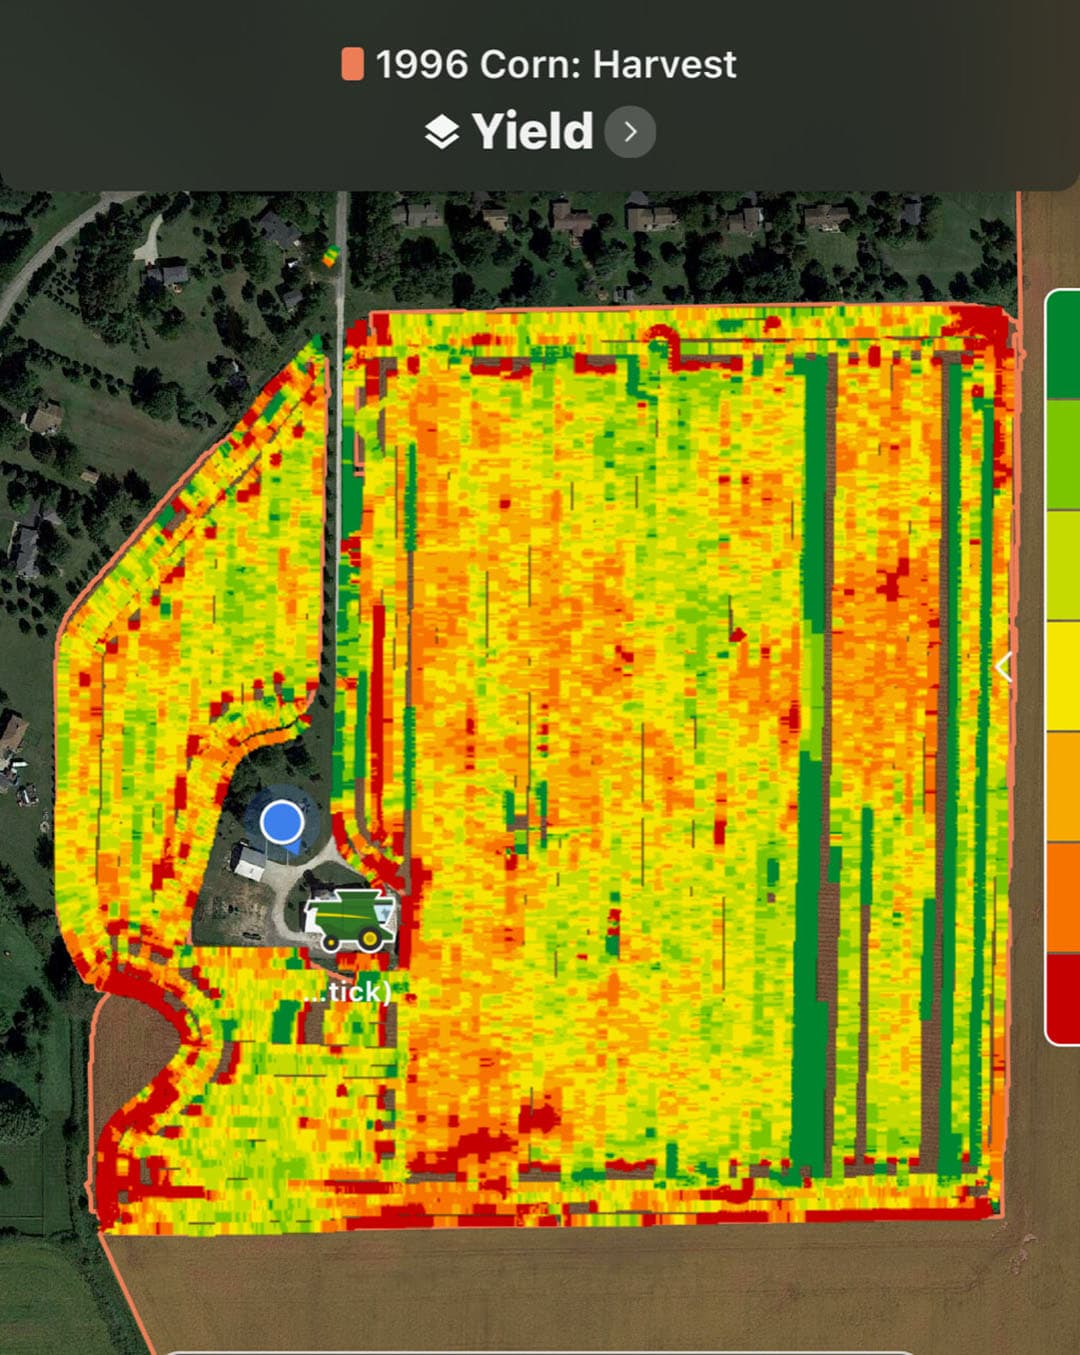
To find out how far their yields were off from the yield potential of the rented fields, Pitstick Farms started making maize yield maps in 1996 already. “These were by any means as advanced as today, but it at least gave us an indication of the variations in yield. Until then, we simple had no clue about that at all. While a yield map is nothing but just a start, we started collecting as much data as possible. Including data on the footprint of machines and on grain cart tracking. Until 2006, we processed all those data manually and that was very time-consuming!” By 2004/2005, the farm started using autosteer and that resulted in even more data being generated.
Text continues below image
Putting data to work
Around the year 2000, Pitstick Farms did their first yield analysis using software from Premier Crop Systems. Steve: “I wanted to put all our data to work to find out whether we were making money on rented land and farms.” Between 2012 and 2015, data collection moved from the machines to the cloud. “We were a large farm with small data until that time. We mainly had been collecting data instead of putting it to work.” The farm uses John Deere’s Operations Centre for data collection and analysis. “Don’t be naïve about the potential (privacy) risks of data sharing, be cautious about it.”
Farmers Business Network
Pitstick takes the same cautious approach when it comes to the Farmers Business Network (FBN, see box) Pitstick Farms joined in 2014. FBN can probably be best described as a data cooperation for farmers that is however not owned by those farmers. During the past half year, FBN has been in the news quite often as data made the company so valuable that it was considering a listing on the stock exchange. By the end of 2022, the company was valued at $ 4 billion. That was $ 100,000 per farm member!
The quantity and quality of the data truly empowers us as farmers
Pitstick: “FBN not only grew because of the amount and size of data it has. By sharing data it could build much larger and more accurate data sets and learn faster. It resulted in an information advantage compared to suppliers and buyers/clients such as BASF, BASF, Bayer, Bunge, Corteva and Cargill. The quantity and quality of the data truly empowers us as farmers. We do not only benchmark our farms but also trail new seed varieties and machines and support their performance and results with data. My data is also getting more precise automatically because the machines we buy keep gaining on accuracy and precision.” Last year, FBN conducted the ‘largest testing of new agricultural products in history’ through its ‘On-Farm R&D Trial Program’.
Text continues below image
From average farmer to one of the best
Pitstick says he took a lot of farm management decisions based on the data within the FBN-platform. “Such as choosing hybrid seed varieties that best fit the soil conditions on our rented land and farms. Using data resulted in a 40 percent increase in maize yields between 1996 and last year. Our average yield increased from 165 bushels per acre (11 ton/ha) in 1996 to 230 bushels per acre (15.5 ton/ha) now. Our average soybean yield grew from 45 bushels per acre (3 ton/ha) in 1996 to 68 bushels per acre (4.6 ton/ha) now. An increase of 51 percent.” For 2022, the University of Illinois and the Ohio State University reported a state maize yield for Illinois of 215 bushels per acre (14.5 ton/ha), an all-time high. The 2022 state soybean yield in Illinois was 64 bushels per acre (4.3 ton/ha).
“I used to be an average arable farmer but thanks to the use of data, I became one of the best. Although the FBN data is currently getting more and more diluted because of the increasing number of members. The plans for a stock exchange listing made me more cautious than I was but I don’t worry about it on the other hand”, Pitstick concludes.
Text continues below video
Join 17,000+ subscribers
Subscribe to our newsletter to stay updated about all the need-to-know content in the agricultural sector, two times a week.


