NASA Harvest launches new water use and crop yield simulator

GEO-CropSim integrates Earth observations into process-based crop models, so decision-makers can monitor and improve crop production while simultaneously analysing water consumption.
GEO-CropSim is a new modeling framework for assessing water use and estimating crop yields at the regional level. It was created by NASA Harvest, in partnership with the U.S. Department of Agriculture (USDA) Agricultural Research Service. This hybrid method of modeling uses satellite imagery, climate data, and farm management information.
Estimate crop yields
The model uses a combination of biophysical and meteorological input data to estimate crop yields. This gives advanced warning of low potential yields and allows farmers and policymakers to evaluate the effectiveness of different management strategies.
GEO-CropSim uses climate, soil, and management decisions while filling in data gaps with satellite imagery that has high spatial and temporal resolution. This combines two common methods of yield estimation. One is a process-based model which combines climate and soil data with management decisions, such as irrigation and fertiliser application, to simulate crop growth in a series of timesteps. Process based models can be very accurate when input data is available but suffer from an unfortunately common lack of data at the necessary scales.
The other is a remote-sensing model. This monitors crops from space and the data is then used to estimate different crop characteristics like leaf area index, land surface temperature, or water content within leaves. These characteristics are then extrapolated to predict overall crop condition and future yield.
Text continues underneath image
EPIC crop simulation
NASA Harvest says GEO-CropSim is based on Environmental Policy Integrated Climate (EPIC) crop simulation, which uses farmer decision data like irrigation and fertilizer application along with soils and climate data. GEO-CropSim expands on the EPIC model by using remote sensing data for both the leaf area index and crop emergency dates.
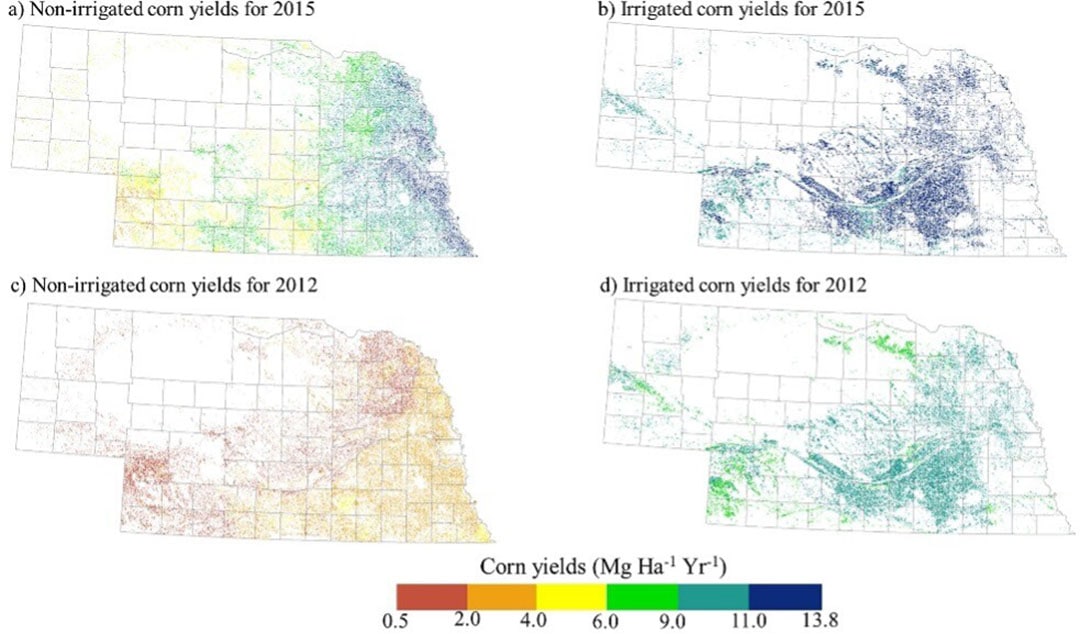
The team tested GEO-CropSim at three locations in Nebraska for both maize and soybean fields. Further, the team wanted to evaluate how the model would work in different growing conditions, so they used data from one drought year (2012) and a non-drought year (2015). After modeling predicted yields for the state in both years, the estimates were compared to historical yield data and ET observations from the USDA’s National Agricultural Statistics Service (NASS). GEO-CropSim was found to produce a higher “granularity” or more specific results across the study sites than the original EPIC model.
Join 17,000+ subscribers
Subscribe to our newsletter to stay updated about all the need-to-know content in the agricultural sector, two times a week.