

Climate FieldView: the journey so far
Seven years after launch, Bayer’s data platform Climate FieldView is going strong, now available in 23 countries. It’s currently used on over 220 million subscribed acres (subscriber numbers are not shared publicly) in the US, Brazil, Canada, Argentina, Ukraine, South Africa, many European countries and beyond.
“The US was our primary market, and it has been the country with the most expansion and adoption,” says Nick Ohrstrom, Director of Global Product Marketing at Climate FieldView. “About two years ago, we started really growing in the European market, mostly Germany, Ukraine, Spain and the UK, and also Argentina and Brazil. We launched a few months ago in Australia, and we knew there would be heavy overlap with users there and how Canadian crop farmers use FieldView because there is a lot of acreage in both countries with oilseeds like canola.”
Like other crop data analysis platforms, FieldView integrates weather and satellite data with data input by farmer-users. That includes what varieties are planted each year at what rate on which fields and when, soil test data as desired, application of crop protection products and in-season nitrogen, other crop practices, date of harvest, yield and more. As mentioned, FieldView also includes local weather station data but also satellite imagery data to provide ongoing pictures of field health in terms of biomass density and vegetation colour analysis.
Text continues below picture
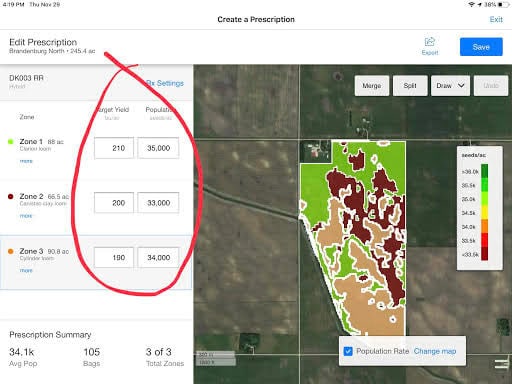
From all this data, users can create seed and fertility scripts for each field, as well as custom reports on fields or zones. “There are many ways of analysing the data,” Ohrstrom explains. “It can be very easy to be overwhelmed at first to have all that data in one place, where before it might have been kept in complete or incomplete form by a given farmer in paper binders and/or digitally, scattered across one or more programs and devices. From installation however, we are very proud that we provide the best support for users as they advance, with an excellent experience for them no matter where they are along the adoption curve. We find that any initial overwhelm quickly disappears.”
Beyond the significant benefit of having all crop data in one place is, of course, using that data to optimize cropping decisions to maximum yields at the lowest cost and highest level of efficiency.
These decisions range from using field health imagery to decide on side-dressing nitrogen or applying fungicide only to parts of a field, comparing hybrids or varieties, comparing rates of fertilizer application and so on. “And the best decision-making to optimize profits and efficiency usually involves sharing data with your agronomist and/or your retailer reps,” says Ohrstrom, “so we enable that in various forms. Generally, it only takes a few hours for a user to be able to quickly produce a certain report and share it.”
And to become proficient, users are supported by a large global team of ‘Climate Activation Specialists’ who help user connect FieldView with their precision ag farm equipment, understand the FieldView basics and then advance to get the most from the technology. As a regional example, there are approximately 100 of these Specialists in the US. Globally, Bayer’s entire digital farming unit has about 1,500 people, with two of the largest areas of focus being science and engineering.
Opting-in to share data
Part of FieldView’s value is that the algorithms have access to data from users to choose to opt in (opt-in rate is not disclosed publicly). That is, aggregated, anonymous data from opt-in users on variety/hybrid choices, time to plant, planting rate, application of crop protection products and much more, are turned into improved script recommendations for those same individual users who have opted in to sharing their data, but also those who do not.
“Of course the more data any crop-growing analysis system has, the better will it be able to deliver the most specific regionalized recommendations to maximize yields with the least costs,” Ohrstrom explains. “Right now there is no direct compensation for sharing data beyond that huge benefit. Having said that, we are exploring how we can provide more benefits for opting in. We believe data sharing must be done in a transparent, clear, secure and reliable manner where farmers decide with whom they share their individual farm data and realize value from sharing their data.”
Text continues below picture
For example, he adds, “we’re thinking about how to take our broader system of seeds and crop protection products and not perhaps providing a discount, but providing some level of guaranteed yield gain from using a certain fungicide, for example. “
However, data sharing to benefit specific opt-in FieldView users is already occurring.
One way is through the ongoing ‘Seed Showcase’ pilot project taking place in some parts of the US. It was jointly developed and tested with growers and dealers to minimize the risk of trying new brands and hybrids/varieties. Seed Showcase farmers split-plant fields with competitor seed and a chosen Bayer corn hybrid recommended by FieldView – and if the Bayer seed doesn’t beat the competitor, Bayer will pay a $6 bu/ac performance warranty, up to a maximum of $60/acre.
Another example of benefiting from FieldView data-sharing is the Preceon Smart Corn System ‘Groundbreaker’ trials this year, also in the US.
This involves short-stature corn hybrids which stand up better to extreme weather like high winds and can be planted at higher densities than standard hybrids. Crop systems typically combine a seed product with use of a crop protection product, but because of differences in how to best manage these hybrids, Preceon is the first crop system Bayer has launched that combines seed also with a digital component – FieldView provides both hybrid placement and planting density recommendations for each field.
Text continues below picture
FieldView is also a significant way for farmers to access carbon credits. With shared user data, FieldView documents the use of farming practices such as no-till/reduced tillage and planting cover crops at scale. This is already a key component of Bayer carbon programs in the US, Brazil, and Europe. In the US, the Bayer program is called ForGround, and farmers who participate are not only compensated for reduced/no-till, cover cropping and other regenerative farming practices, but also receive discounts on farm equipment and cover crop seed, which helps them make the transition to these practices.
New features
As with any technology, FieldView continues to evolve based on feedback on what growers and agronomists are using the system for, in different regions and crops – and also what they would like to use it for.
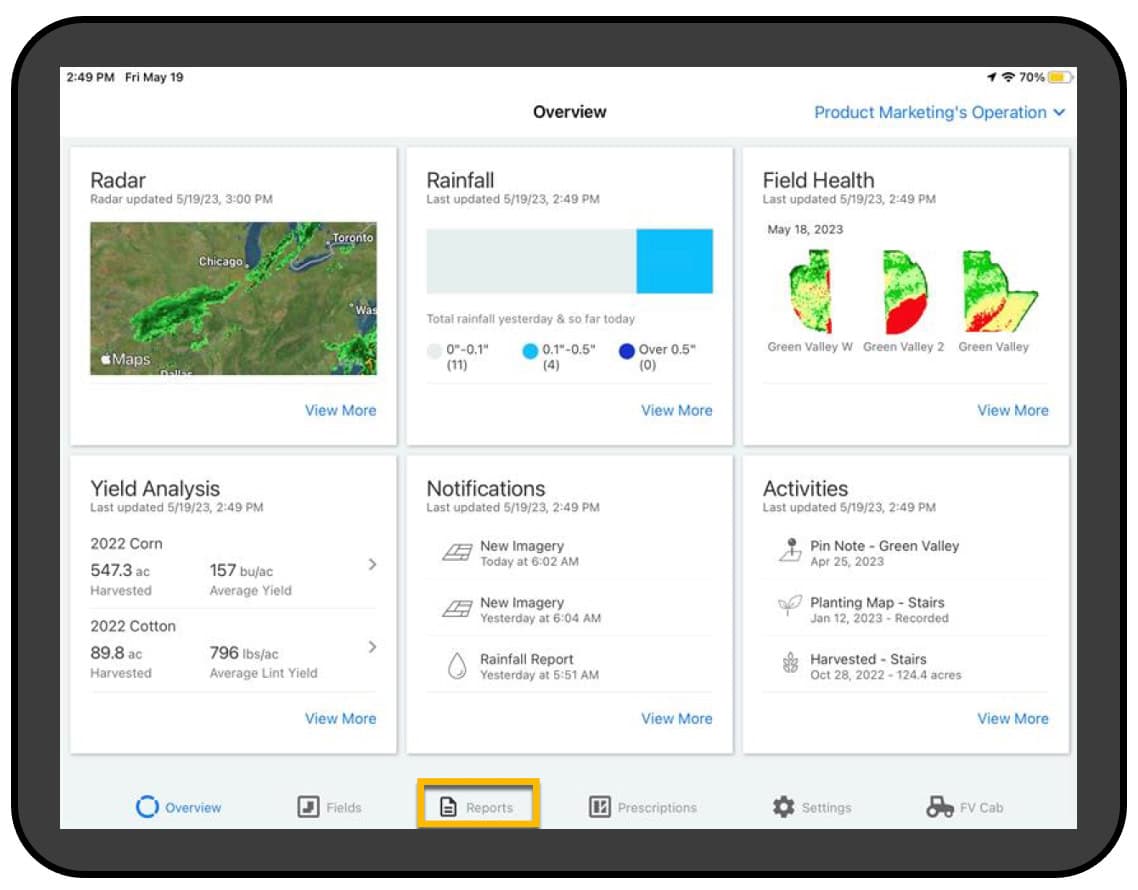
Recently, due to user requests, more filters have been added in the planting and application and yield reporting tools, so that data can be looked at in more ways. Users also wanted to be able to email reports to their agronomists or other advisors, so FieldView now enables reports to be converted in CSV or PDF formats that are small enough to be sent through email.
Text continues below picture
Text continues below picture
In addition, FieldView has also expanded field reports so that users can create zones within large fields to compare usage rates of crop protection products. They could track use of two or more seed choices in one field before, but not product application rates. This means farmers can do their own tests of products right in the same field with the same growing conditions.
Ohrstrom adds that “also, FieldView Cab for Android is being beta tested globally and this is very exciting for us because this will expand the number of farmers who will benefit from the platform. Before, we required the use of Apple devices, we rolled out FieldView with that operating system first as the majority of our first potential customers were already Apple users for whatever reason.”
Price and market reach
FieldView pricing varies by region but in the US, it’s $99 USD a year plus hardware if farm equipment isn’t already integrated with FieldView.
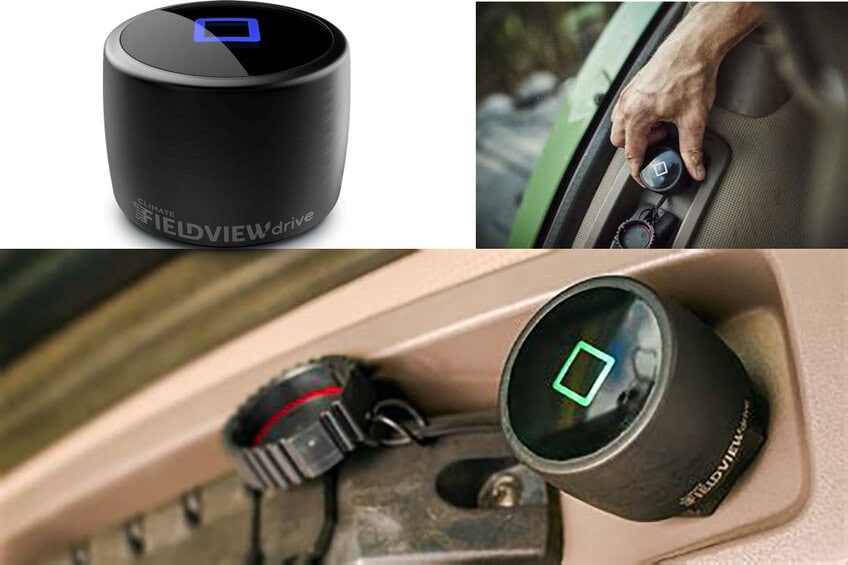
The FieldView Drive device is portable, allowing you to collect data on your compatible planter, sprayer and combine, and costs about $500. One or two of these would typically be recommended for an operation of 5000 acres. However, there are customers who farm >5k acres without a FV Drive, and farmers also use more manual tools like Data Inbox if they don’t have a FV Drive, or stream directly from their Precision Planting 20/20 monitors.
“We have about 90 per cent compatibility with all tractors, planters, applicators and combines,” says Ohrstrom. “If farmers have incompatible equipment, there are other options like Data Inbox to capture data. You can also upload data seamlessly from flash drives or other systems.”
Text continues below picture

Text continues below picture
Advanced uses
One example of an advanced use of FieldView relates to fungicide, which is generally applied at least once every year to soybeans in Ontario. On some operations such as R.M. Matheson Farms in Embro, Ontario, growers are using FieldView to take what’s called an ‘on-off’ approach with the potential second spray in soybeans to control white mold. This second spray can occur provided growers aren’t tied up with spraying corn or other tasks at the time. Co-owner Ian Matheson was an early adopter of FieldView and has used it for seven years.
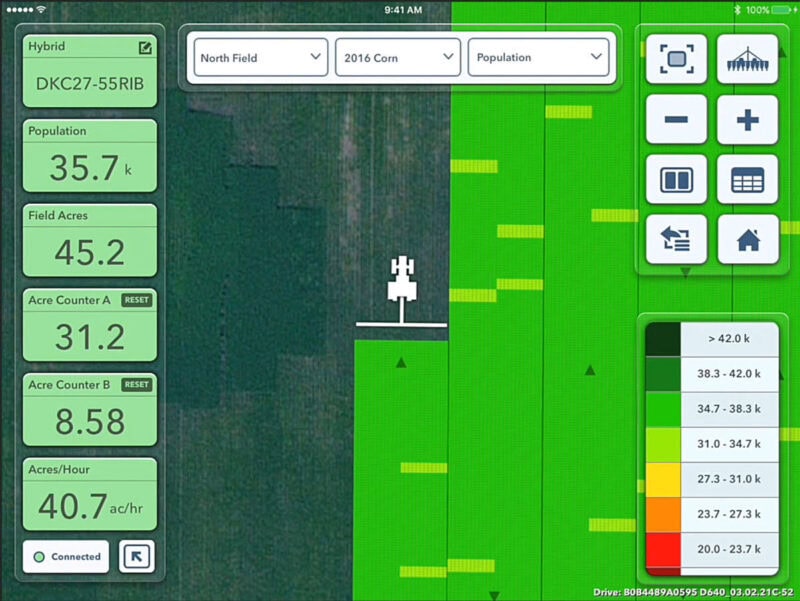
The ‘‘on-off’ approach is based on very accurate satellite data from FieldView showing exactly where the growing soybeans are especially lush and therefore at higher risk for white mold.
Spraying those areas (sprayer on) is therefore worthwhile, but a waste of time and resources to do so in other, less lush areas (sprayer off). This approach helps protect yield while saving time and increasingly-expensive fuel and fungicide.
For more
See other stories from users here: https://climate.com/
Join 17,000+ subscribers
Subscribe to our newsletter to stay updated about all the need-to-know content in the agricultural sector, two times a week.


