

“Seeing” your crop’s health for improved productivity


Effective crop health on a global scale is a very present possibility, offering insightful, actionable information to decision makers. These new practices will promote improved crop management practices and optimize crop productivity.
Rwanda’s Huye District is home to the country’s second largest city, Butare, as well as the iron rich, red-soiled hills of the Maraba region. This is the nation’s basket for Coffea arabica production.
Here, plant fertilization begins in summer and the fruit is handpicked between March and May, the region’s rainy season. Maraba’s Bourbon variety of Coffea arabica first presents as a small, lush, green bud. Then, as the fruit ripens, pericarp coloration transitions to pale yellow, then light orange, bright red, and finally dark red at the time of harvest.
Text continues underneath Figure

This senescence is also revealed in transitions of the elliptical, shiny, dark green and waxy leaf of the coffee tree. This tree follows a process of degeneration through the season, where cellular organelles and biomolecules, including nucleic acids, proteins and lipids, are broken down as the leaf transitions from nutrient assimilation to nutrient mobilization into sink tissues such as reproductive organs and new leaves (Guo et. al., 2021).
Much more color than the human eye can see
Each individual color transition is indicative of crop health and – by extrapolation – expected productivity. Some of the colors are visible to us, and many more extend into the infrared portion of the electromagnetic spectrum.
As you may intuit, with more light bands we improve our ability to discern reflectance transitions in the Coffea arabica pericarp. Or in layman’s terms: the more colors, the better. As we more accurately interpret localized crop health indications, we can more effectively amend fertilization and irrigation requirements.
Enabling technology now lets us see beyond color…
Crop health management has always been an intensely manual process. Today, the availability of hyperspectral imaging offers an ability to objectively, digitally measure health by following the ebb and flow of senescence during crop cycles and lifetimes.
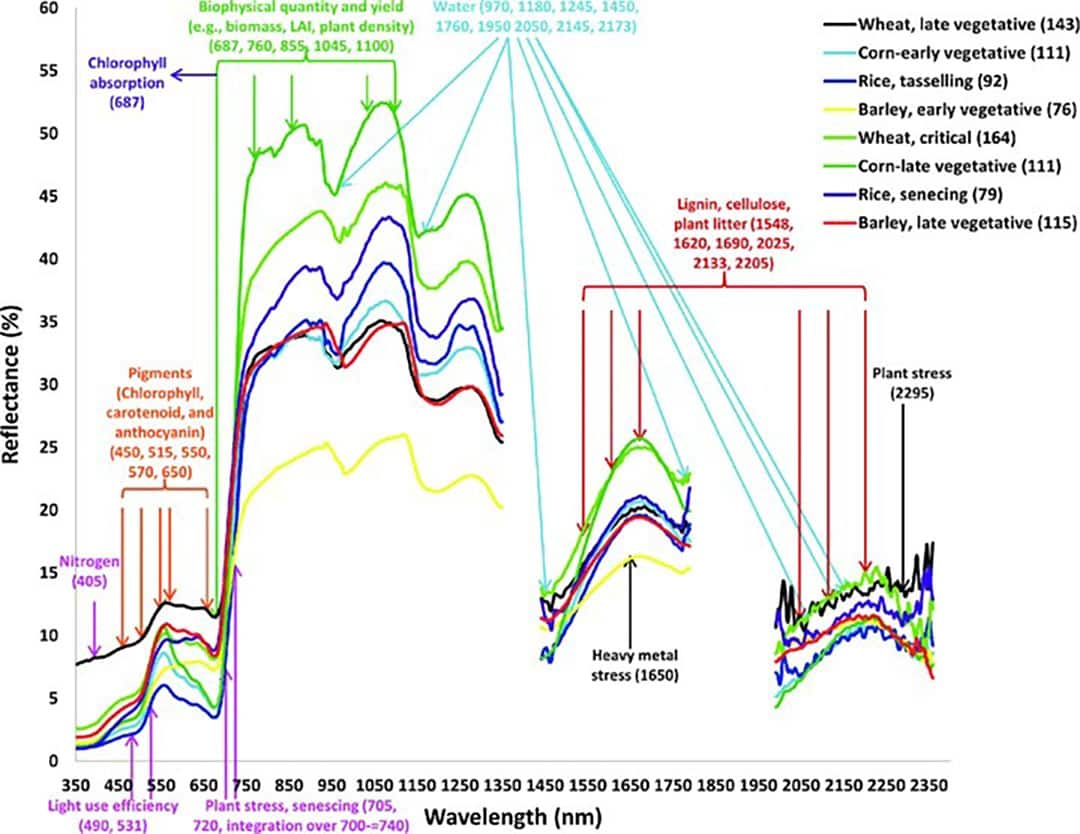
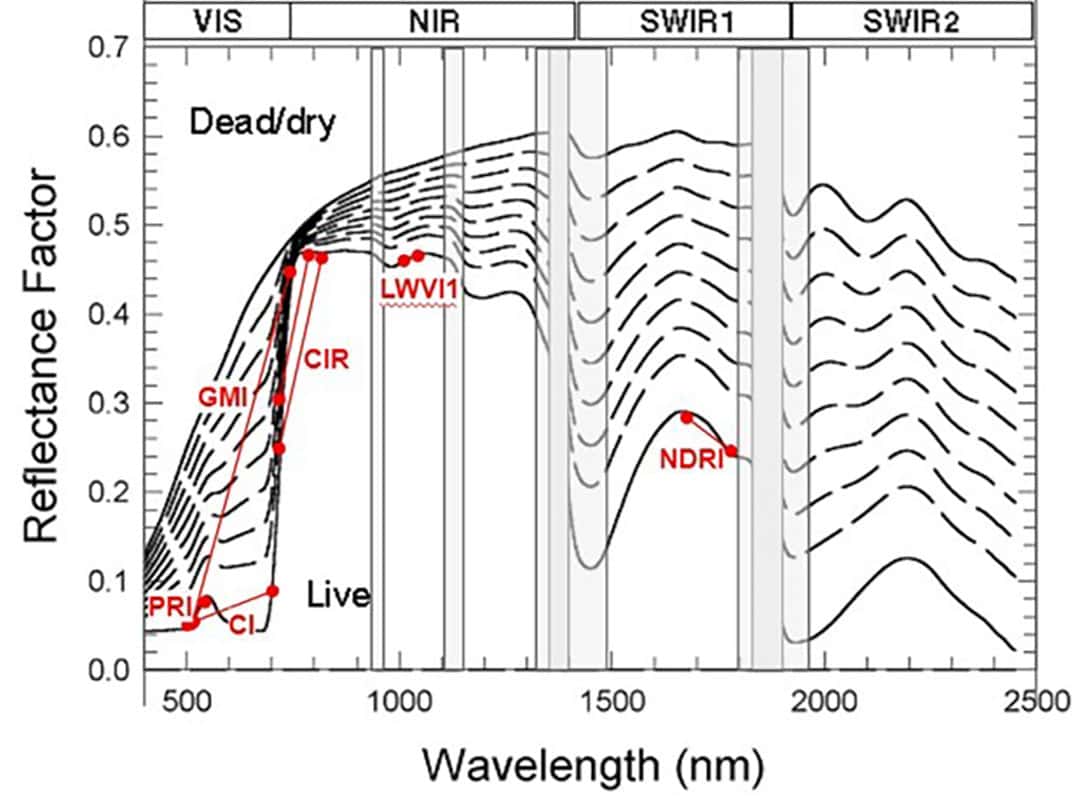
By measuring for absorption or how dark a reflectance might be, multiple indicators for plant health can be extracted during the growing season: Within the visible portion of the electromagnetic spectrum, or 400-700 nm, plants are generally characterized by near total absorptions from leaf pigments (e.g. chlorophyll a & b, carotenoids, and anthocyanins), as well as a sharp increase in reflectance between visible and near-infrared known as the red edge.
Within the near infrared, approaching 900 nm, absorptions are predominantly due to cell structure (i.e. mesophyll) and water. Above 1000 nm, short-wave infrared absorptions are particularly sensitive to protein, lignin, and cellulose.
Text continues underneath Figure
… and better manage our crops to improve yield
Today, farmers are poised to benefit from information hidden within the electromagnetic spectrum. For example, analytics company Orbital Sidekick (OSK) is now beginning to employ its own aerial and satellite-based hyperspectral imagers for commercial agriculture, enabling these reflectance absorptions to be probed for vital information about crops.
More specifically, in searching for indicative hyperspectral indices, specific portions of the spectrum are probed for vegetation features like Leaf Area Index, Nitrogen, Dry Weight, Water Content, Protein, Starch, Sucrose, Fructose, Glucose and Chlorophyll, to name just a few. OSK’s global hyperspectral satellite constellation will be operational beginning in 2022.
Text continues underneath Figure
Effective crop health on a global scale is a very present possibility, offering insightful, actionable information to decision makers. These new practices will promote improved crop management practices and optimize crop productivity.
Join 17,000+ subscribers
Subscribe to our newsletter to stay updated about all the need-to-know content in the agricultural sector, two times a week.


